Oral Presentation International Solvent Extraction Conference 2025
Flow Characteristics of Two Phases in Stirred Type Emulsion-flow Extractor (122662)
A novel extractor, denoted as emulsion-flow extractor has been applied to many liquid-liquid extraction systems and the high efficiency and compactness of the equipment was reported in literature. The method is characterized by supplying both phases in the form of droplets within the column. The droplet layer at a constant thickness is formed in the middle of the column. The droplet layer is called as emulsion-phase, and due to the large interfacial area and the counter current flow of aqueous and organic phases, mass-transfer was enhanced in a compact column-type device. Since the thickness of the droplet layer reached about one third of the total column height, there is a circulation of droplets inside the droplet layer.
To evaluate the degree of mixing inside the droplet layer, a method was proposed to evaluate mixing strength with a help of color tracer technique. By using video images of colored organic and aqueous phase and the laboratory-made methods of image analysis, a residence time distribution was easily determined. Also, the method was easily applied to determine the residence time distribution of the whole extractor.
A thin rectangular emulsion-flow extractor was used for the equipment. The column is made of transparent vinyl chloride resin, with the section area of 60 mm in width by 20 mm in depth, and the height of 300 mm. Pure n-heptane, serving as the organic phase, was supplied from the bottom through a distributor. Deionized water, constituting the aqueous phase, was dispersed from the top of the column with a nozzle. The two phases flowed in counter-currently. A LED light set at the back of the column gave a light, and D7500 Nikon was employed to capture the flow dynamics of emulsion phase within the column.
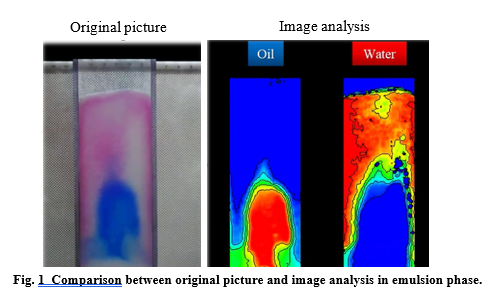
Figure 1 indicates an example of the original and processed image with the laboratory made software. Image analysis was successfully applied to enhance the colour contrast to evaluate the residence time distribution utilizing the software developed in the laboratory. In comparison to the traditional chemical tracer technique, image analysis overcame spatial and temporal constraints, facilitating continuous processing at any time and from any position, even in the presence of distinct tracers for both aqueous and organic phase simultaneously, without hindrance.
To determine Peclet number, the outlet positions of emulsion phase were subjectively designated in Fig.1 with the red-shaded zone at the bottom defined as the outlet of aqueous phase, and blue-shaded zone at the top defined as the outlet of organic phase. Each shaded zone was evenly divided into 60 parts, with parting lines numbered from 0 to 60. The tracer concentration at the outlet was quantified as the average value of seven points 0, 10, 20, 30, 40, 50, and 60. By adopting this approach, the RTD curve and Pe specifically focusing on the emulsion phase could be derived.
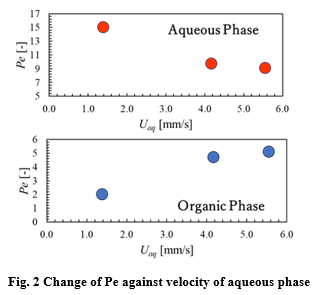
Figure 2 shows the resulting trend of Peclet number, Pe against aqueous phase velocity. Pe of aqueous phase decreased with increasing the velocity of the aqueous phase owing to the enhanced mixing effect by the increase in kinetic energy. Conversely, Pe of organic phase increased with increasing Uaq. This might be due to the coalescence of organic-phase droplets, resulting in larger, more stable droplets.
References
[1] N. Yanase, H. Naganawa, T. Nagano and J. Noro, Analytical Sciences., 27 (2011) 171-176.
[2] M. Hirayama, T. Goshima, K. Mizuta, S. Nii, Solvent Extraction Research and Development, Japan., 27 (2020) 125-133.
- Abstract category selection: