Oral Presentation International Solvent Extraction Conference 2025
Assessing the Mass Transfer During Droplet Formation Using a Novel 2D-Raman Measuring Setup (121443)
Introduction
Assessing mass transfer in individual droplets is vital for enhancing our understanding of key elements in extraction processes within chemical engineering. Despite significant advancements in measurement techniques, achieving a precise understanding and quantification of mass transfer at the micro-scale in single droplets remains a challenge.
Optical measurement methods present a promising, non-invasive, and rapid means to obtain two-dimensional concentration profiles of liquid-liquid systems during mass transfer [1]. Two commonly used measuring techniques for the visualization of mass transfer during droplet formation are Laser Induced Fluorescence (LIF) [2-5], as well as Schlieren photography [5-7]. Both measuring techniques only allow for the indirect assessment of the local concentration of the solute. While the application of LIF calls for the addition of a fluorescent tracer to the liquid-liquid system, Schlieren photography visualizes changes in local refraction indices throughout the entire three-dimensional measuring volume in a two-dimensional image.
In this contribution, we present a measuring setup that employs 2D-Raman spectroscopy specifically designed to directly assess mass transfer in single droplets.
Experimental Facility
The measuring setup features a laser with a wavelength of 532 nm and a maximum power output of 52.5 W. The emitted laser beam is formed to a laser sheet with a nominal height of 10 mm and a nominal width of 0.1 mm and passes through the measuring volume inducing Raman scattering in the illuminated cross-sectional area. The Raman signal is observed through a bandpass filter orthogonally to the laser sheet by a camera. As a model system, the system water / toluene / acetonitrile was chosen. One exemplary Raman spectral image of the 4 mm toluene droplet with an initial acetonitrile concentration of 10 wt% can be seen in Figure 1.
Results
Applying the novel 2D-Raman measuring setup to droplet formation experiments, we were able to visualize the mass transfer during droplet formation. The experiments showed Marangoni convection and the formation of vortexes within the droplets as well as the occurrence of a post-carriage effect with ongoing mass transfer. These observations align with findings documented in the literature for the water / acetone / toluene system, emphasising the suitability of our measuring setup for the assessment of mass transfer during droplet formation. Calibration measurements in single-phase systems indicated linear correlations between measured intensities and solute concentrations in both the organic and the aqueous phase. However, a baseline shift in the organic phase was observed, likely due to the presence of toluene. Applying the established linear correlations to droplet formation experiments led to an overestimation of local concentrations. This discrepancy was attributed to variations in local laser intensities resulting from light refraction at the curved droplet interface.
Conclusion
By choosing Raman spectroscopy as a measuring technique, we achieved a direct assessment of the local concentration field of the solute without the need for auxiliary substances such as fluorescent tracers. Another key benefit of the setup is its adaptability to various liquid-liquid systems by adaptation of the applied bandpass filter. Prerequisite for this is the existence of a clearly identifiable peak in the Raman spectra, which can be assigned to the solute. With this cell, we aim to enhance the understanding of mass transfer within single droplets via the direct measurement of concentration distributions in liquid-liquid systems.
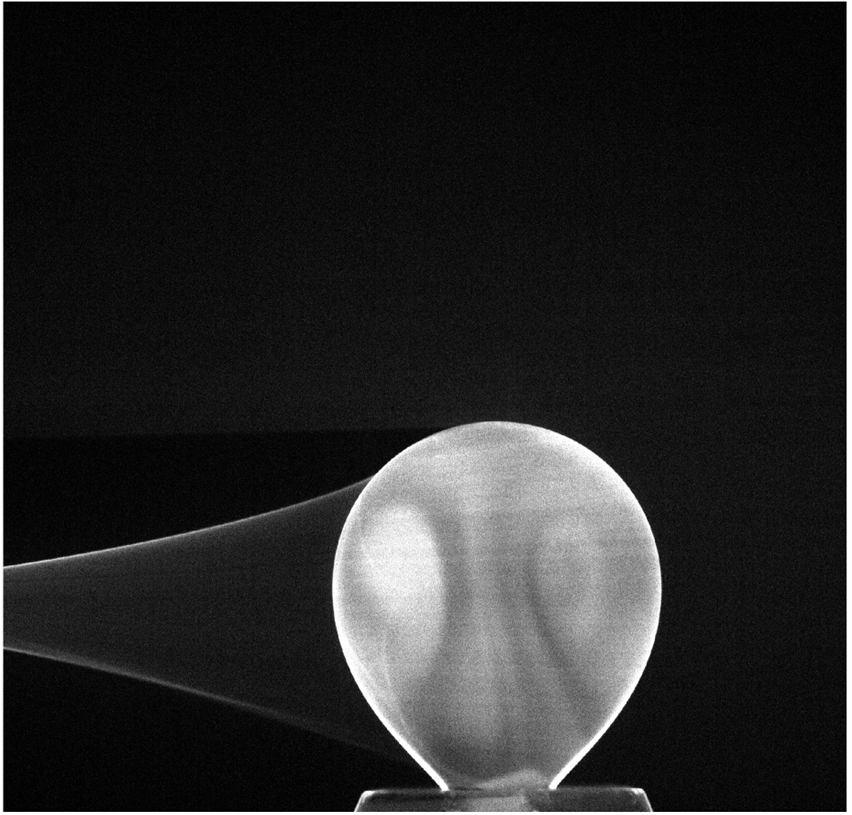
Figure 1. Raman spectral image of a 4 mm toluene droplet in water with an initial acetonitrile concentration of 10 wt% after 92 seconds.
- D. Ambrosini and P. Ferraro, "Here, there and everywhere: The art and science of optics at work," Optics and Lasers in Engineering, vol. 104, pp. 1–8, 2018, doi: 10.1016/j.optlaseng.2018.01.009.
- Z. Wang, J. Chen, X. Feng, Z.-S. Mao, and C. Yang, "Visual dynamical measurement of the solute-induced Marangoni effect of a growing drop with a PLIF method," Chemical Engineering Science, vol. 233, p. 116401, 2021, doi: 10.1016/j.ces.2020.116401.
- J. S. Heine and H.-J. Bart, "Visualization of Mass Transfer during Droplet Formation," Chem Eng & Technol, vol. 42, no. 7, pp. 1388–1394, 2019, doi: 10.1002/ceat.201800706.
- J. S. Heine and H.-J. Bart, "Local analysis of Marangoni effects during and after droplet formation," Can J Chem Eng, vol. 98, no. 5, pp. 1164–1171, 2020, doi: 10.1002/cjce.23685.
- J. S. Heine, J. M. Schulz, H. Junne, L. Böhm, M. Kraume, and H.-J. Bart, "Real‐Time Visualization of Internal and External Concentration Fields in Multiphase Systems via Laser‐induced Fluorescence and Rainbow Schlieren Deflectometry During and After Droplet Production," Chemie Ingenieur Technik, vol. 93, 1-2, pp. 180–190, 2021, doi: 10.1002/cite.202000135.
- J. M. Schulz, H. Junne, L. Böhm, and M. Kraume, "Development of an experimental setup applying rainbow schlieren deflectometry for visualization and quantification of heat and mass transfer in multiphase systems," Proceedings of the 5th International Conference on Experimental Fluid Mechanics, Munich, 2018.
- Q. Mao, Q.-J. Yang, Y. Liu, and W. Cao, "Experimental and numerical study of droplet formation with Marangoni instability," Chemical Engineering Science, vol. 268, p. 118369, 2023, doi: 10.1016/j.ces.2022.118369.
- Abstract category selection: