Oral Presentation International Solvent Extraction Conference 2025
Characterization of the interface in a liquid-liquid extraction system containing monoamide and uranyl by X-ray reflectivity (121636)
Understanding the (supra)molecular structure of interfaces containing amphiphilic ligand molecules is crucial for deciphering ion transfer mechanisms in solvent extraction. While thermodynamic modeling and molecular dynamics simulations provide valuable insights into molecular distribution and configurations in solution[1][2], experimental data on the spatial distribution of extractant molecules and ions at the liquid-liquid interface remain scarce. Previously we demonstrated that the combined use of X-ray and neutron reflectivity was a powerful approach for elucidating interfacial structure and potential in systems involving different lipophilic ligands. Notably, we had shown for the first time that hard trivalent cations can be either repelled or attracted by diamides extractant-enriched interface depending on the ligand’s nature[3].
In this study, for the very first time we investigated by X-ray reflectivity a liquid-liquid interface (dodecane-water) of an extraction system containing the monoamide di-2-ethylhexyl-isobutyramide (DEHiBA) and uranyl at concentrations relevant to industrial processes. X-ray reflectivity experiments conducted at ESRF on ID10 beamline[4] allowed us to not only determine the dependence of the thickness of the interface on either the initial uranium concentration in the aqueous phase or the concentration of extractant in the organic phase (see Figure a, b) but also to track the evolution of uranyl excess concentration at the interface as a function of time (see Figure c). Reflectivity data were extracted from detector 2D images using a program written in Python, which tracked the reflected beam and eliminated absorption effect and background signal. Analysis of the reflectivity profiles with a simple stratified model (Parratt’s formalism) was developed to describe the interface and interpret the experimental results. It revealed the formation of a diffuse uranyl-enriched thick layer (an interphase) rather than a well-defined monolayer. As the system approaches equilibrium, the thickness of this layer gradually increases, while the uranyl concentration within it rises slowly yet remains significantly higher than that in the organic bulk phase. Furthermore, the thickness of this layer is directly proportional to the initial extractant concentration in the organic phase, whereas the initial uranium concentration in the aqueous phase has a comparatively smaller impact.
These findings support those obtained for DMDBTDMA diamide by E. Scoppola[3], who observed the formation of a thick interface that apparently allows an incursion of the hydrated neodymium ions that can be complexed by the extractant, with the only difference being that the latter were obtained at a much lower concentration far from concentrations relevant to industrial processes. Indeed, in the case of diamides extractant, the reflectivity experiments were limited in concentration due to the formation of aggregates that generate more scattering than in the case of DEHiBA. Our results provide new insights into interfacial enrichment mechanisms in liquid-liquid extraction systems, with implications for optimizing ion separation processes.
Figure Details:
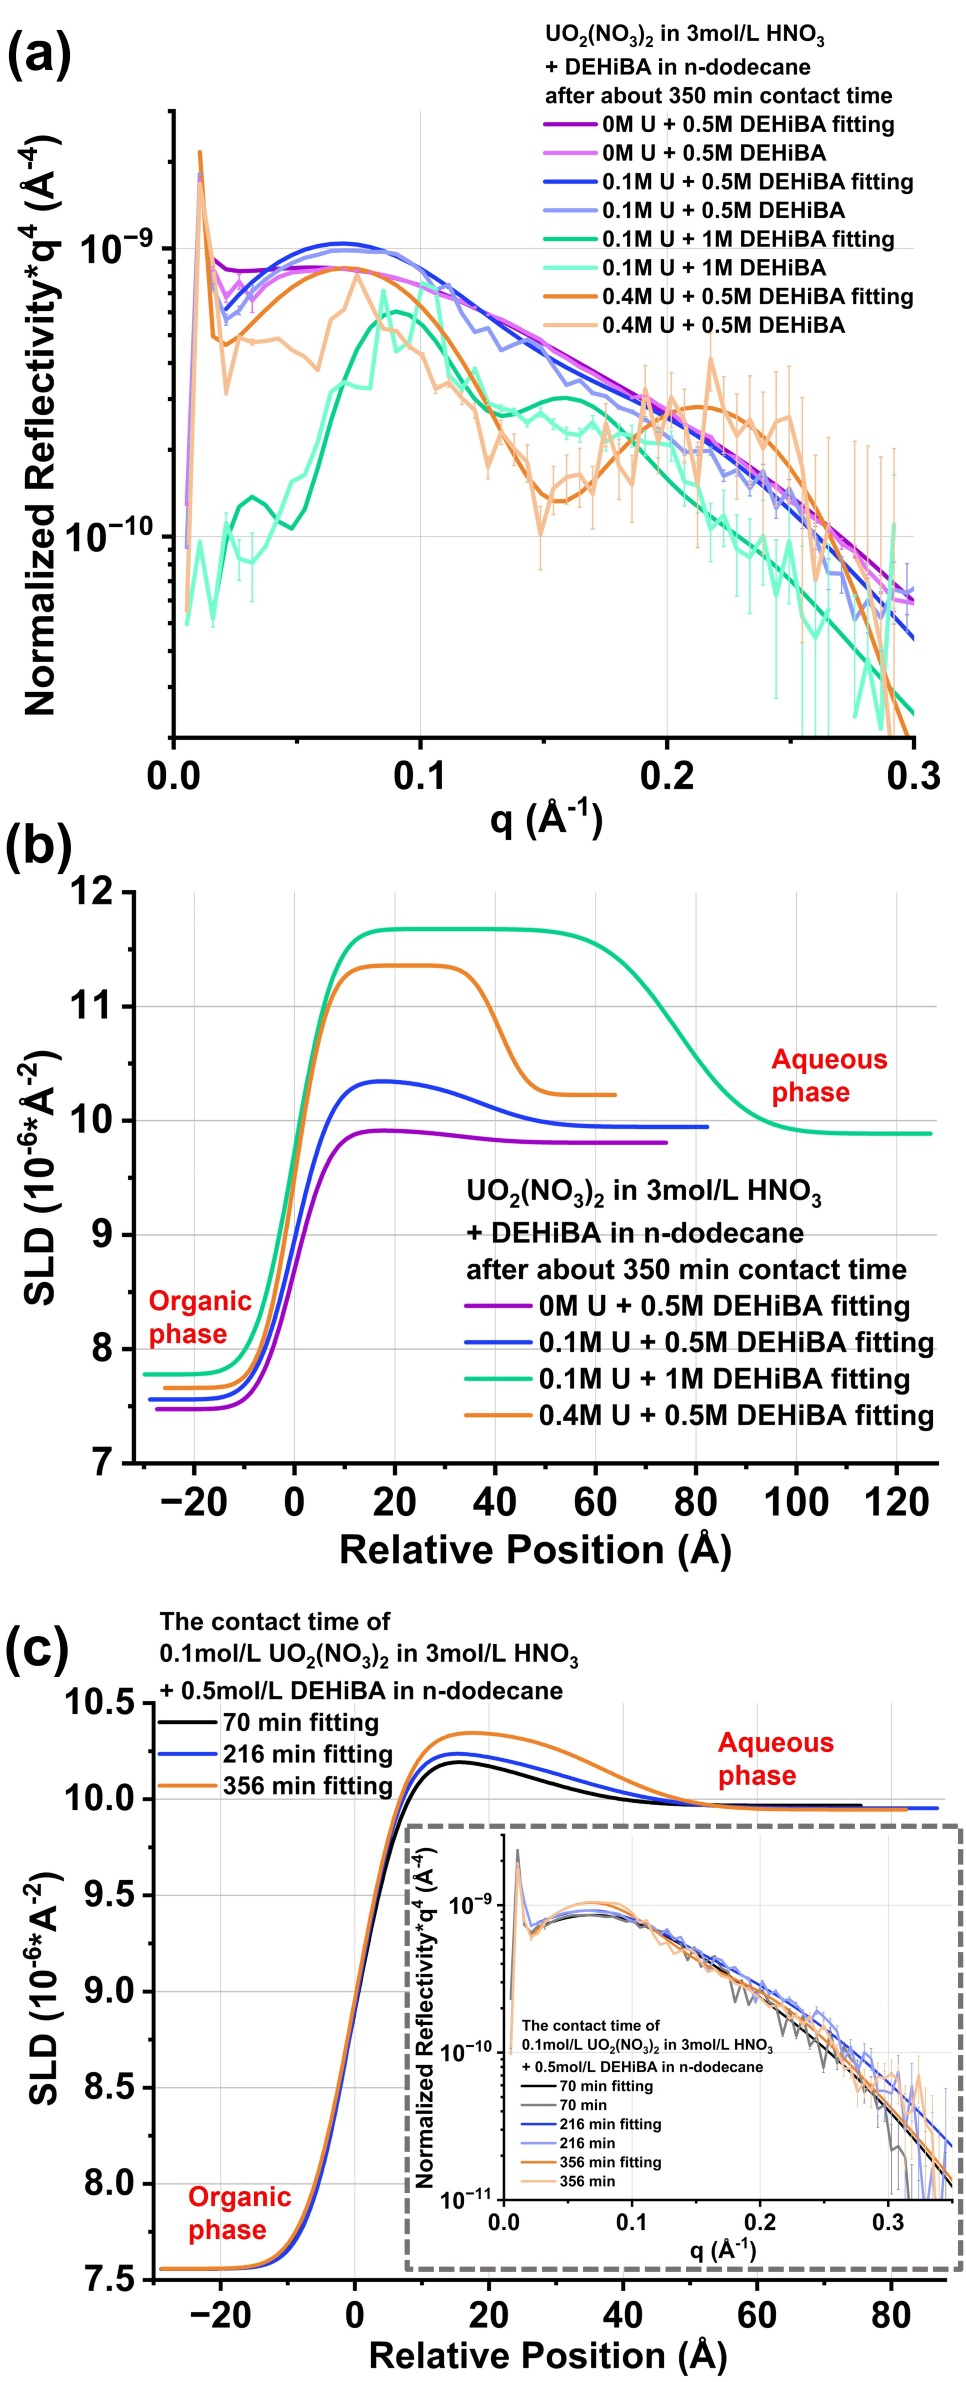
Figure (a): to highlight oscillations in the reflectivity curve, the liquid-liquid interface reflectivity curve multiplied by the fourth power of q is plotted as a function of q for 0, 0.1 and 0.4 mol/L UO2(NO3)2 with 3 mol/L HNO3 as the aqueous phase and 0.5, 1 mol/L DEHiBA with n-dodecane for the organic phase under approximately the same contact time conditions. The 30keV X-rays are incident on the interface through the organic upper phase. In the organic bulk phase, the uranyl nitrate concentration gradually increases on the micrometer scale as it approaches the layer, resulting in greater X-ray absorption and scattering. This effect makes extracting reflectivity data more challenging and inevitably introduces more noise signals under higher uranyl nitrate concentration conditions.
Figure (b): the SLD (Scattering Length Density, which is proportional to the electron density) profile across the interface that can be deduced by a relevant adjustment of the reflectivity curve in Figure (a), is plotted as a function of the relative distance from the interface. Since the SLD difference in this liquid-liquid system is primarily influenced by the presence of uranyl nitrate, their concentrations are proportional to the SLD values.
Figure (c): SLD profiles of the diffuse uranyl-enriched layer at the interface of 0.1 mol/L UO2(NO3)2 with 3 mol/L HNO3 and 0.5 mol/L DEHiBA with n-dodecane at different contact times. The corresponded reflectivity curves multiplied by the fourth power of q as a function of q are also plotted on the inserted graph.
- [1] Hall G B , Campbell E L , Bessen N P et al. “Extraction of Nitric Acid and Uranium with DEHiBA under High Loading Conditions”. Inorganic Chemistry, 2023, 62(17): 6711-6721.
- [2] Ferru G ,Donatien Gomes Rodrigues, Berthon L et al. “Elucidation of the Structure of Organic Solutions in Solvent Extraction by Combining Molecular Dynamics and X-ray Scattering”. Angewandte Chemie, 2014, 53(21): 5346-5350.
- [3] Scoppola E , Watkins E B , Campbell R A et al. “Solvent Extraction: Structure of the Liquid–Liquid Interface Containing a Diamide Ligand”. Angewandte Chemie International Edition, 2016, 55(32): 9326-9330.
- [4] Konovalov O , Rein V , Saedi M et al. “Tripling of the scattering vector range of X-ray reflectivity on liquid surfaces using a double-crystal deflector”. Journal of Applied Crystallography, 2024, 57(2): 258-265.
- Abstract category selection: